Frasier Meets Data Visualization

Revisiting and revamping my first visualization project.
Published on July 02, 2022 by Claudia Chajon
Python Tableau data cleaning web scraping
3 min READ
Revisiting my first data project
In 2019 I first started my data journey, I decided to apply my new found passion to something that I watched almost all the time. So then, Frasier first met data visualization. I found the entire show’s transcript on kaggle.com. The dataset wasn’t perfect, and I tried to work with what I had and what new skills I had just learned.
Looking back on that project now, I can admit that it needs to be revamped.
So begins the project anew!
The data
The dataset I originally used was still on Kaggle, and was still serviceable for the most part. It was missing key information that I wanted to visualize, so I scraped what I need from various websites.
Step I : Scrape IMDB for TV show ratings
Identify needed components for scraping
The variables we are looking for are:
- Season
- Episode Number
- Episode Title
- IMDB Rating
- Total Votes
- Airdate
- Episode Description
This is what the IMDB page for the show Frasier looks like,
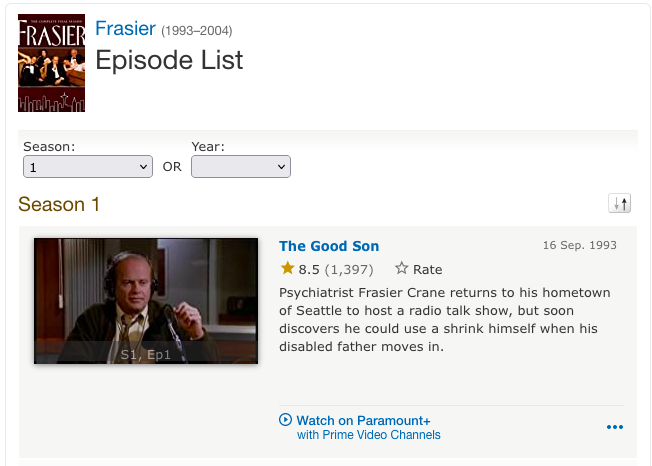
This is the url of that page. The highlighted portion in unique to the show on the IMDB website.
https://www.imdb.com/title/**tt0106004**/episodes?season=1
We will be using requests and BeautifulSoup as the tools for scraping.
import pandas as pd

from requests import get
from bs4 import BeautifulSoup
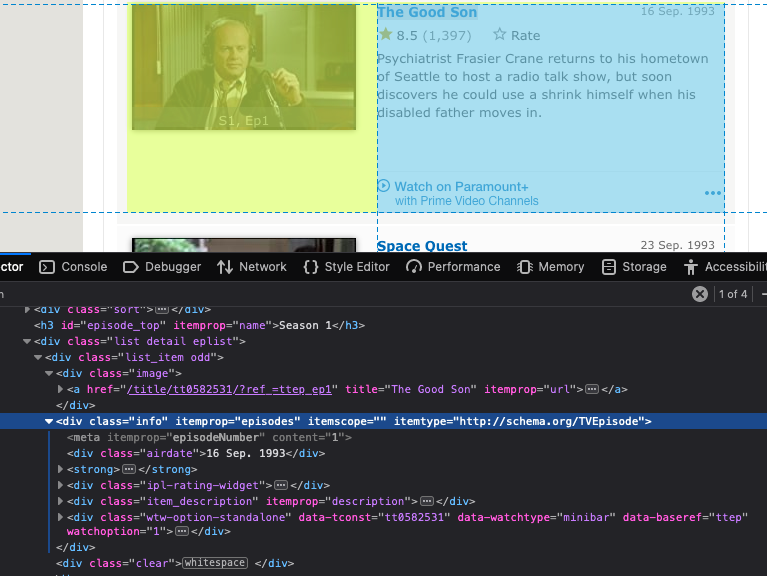
After inspecting a bit, I found the container that housed the information we want was in <div class=”info” …> </div>
We can move forward now with the data extraction. Request content of web page from server. Response will hold the HTML received.
url = 'https://www.imdb.com/title/tt0106004/episodes?season=1'
response = get(url)
print(response.text[:250])
Using Python’s built-in HTML parser and BeautifulSoup, we can parse the HTML received.
 html_bs = BeautifulSoup(response.text, 'html.parser')
type(html_bs)
We want to grab all instances of information for each episode on the page, find_all() will return all these instances. Season 1 has 24 episodes.
ep_containers = html_bs.find_all('div', class_='info')
In order to grab all season and episodes, two for loops can be used. One for the seasons and another for the episodes within those seasons. A pandas DataFrame is the intended outcome.
Frasier has 11 seasons, so my range was (1 , 12).
Now the cleaning can begin.
Data Cleaning
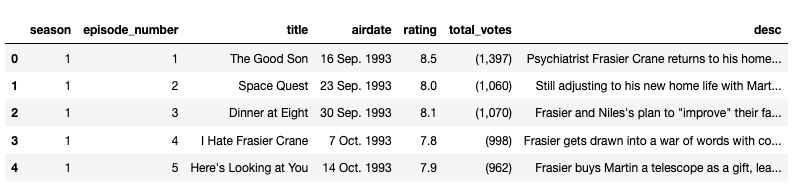
After checking the data types in the dataframe, we can see what needs formatting and splicing.
To Do:
- remove ‘( )’ and ‘ , ’ from [total_votes]
- [episode_number], [rating], and [total_votes] should all by integers
- [airdate] should be changed to DateTime format
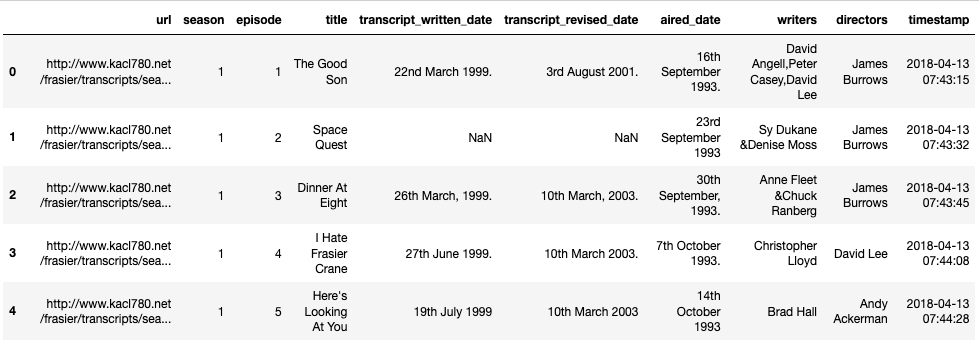
Step II: Clean Up the Kaggle Dataset
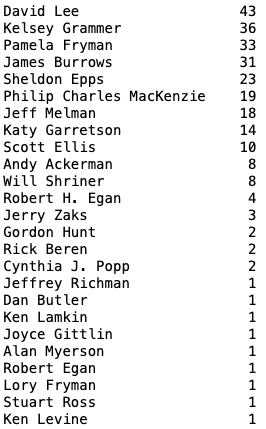
Now on to the Kaggle data. The “episodes” dataset was a bit of a mess. I decided to start with the [directors] column. Since it had multiple misspellings of names and this made the data wonky. We have to track down all misspellings and change them to the right name so that they can be used later in a few charts.
Director Philip Charles MacKenzie’s name was misspelled a number of ways, almost every way imaginable. We can use a catch all to find all instances of the name Philip and replace it with the correct spelling.
fraz.directors.str.replace(r'(^.*Philip.*$)', 'Philip Charles MacKenzie')
Kelsey Grammer is also an often misspelled name, I also found a handful of others that needed fixing/replacing.
In the end we have our [directors] column nice and tidy.
There was more information that I need to scrape from various sites. The process basically followed the same steps, find the page that held the information, scrape, clean and format.
Visualize
I used Tableau to visualize a variety of charts based on the data I had gathered. The final product can be seen on my Tableau Public Profile.