Kickstarter Success/Failure

Using machine learning to predict success of Kickstarter campaigns.
Published on February 10, 2021 by Claudia Chajon
Python data analysis data visualization machine learning
4 min READ
Using machine learning to predict successful campaigns
– —
–
Kickstarter is a company that allows creative projects to come to life through crowdfunding.
People who become project backers are offered perks as rewards for pledging money towards the project. These perks are incentives to bring in more backers and thus fulfill the monetary goal of the project.
Within these 15 main categories, there are various sub-categories that further identify a project.
From inception, Kickstarter was a notable and fast-paced vehicle for a project to streamline a way to accrue funds.
For this project, I scraped data from webrobots.
Data was gathered and cleaned so that it could be used for visualizations and machine learning models.
The Data
Here are the original columns that came from the scraped data. While this does give us a lot of information on projects from 2009 until 2021, there were things that I had to drop, clean, or change completely in order for the data to give meaningful information.
Index(['backers_count', 'blurb', 'category', 'converted_pledged_amount',
       'country', 'country_displayable_name', 'created_at', 'creator',
       'currency', 'currency_symbol', 'currency_trailing_code',
       'current_currency', 'deadline', 'disable_communication', 'friends',
       'fx_rate', 'goal', 'id', 'is_backing', 'is_starrable', 'is_starred',
       'launched_at', 'location', 'name', 'permissions', 'photo', 'pledged',
       'profile', 'slug', 'source_url', 'spotlight', 'staff_pick', 'state',
       'state_changed_at', 'static_usd_rate', 'urls', 'usd_pledged',
       'usd_type'],
      dtype='object')
Cleaning data is where most time is usually spent, to clean one has to understand the data and the relation keeping it all together.
One of the many obstacles I faced when looking at the data was with a column named “category”; within that column, there were 158 unique categories.
This seemed a bit messy if I were to visualize category counts.
So after a little research, I added a new column called “main_category” to the dataset. It is made up of 15 possible categories that contain the 158 original categories.
Every sub-category now had a home in the main category and this new column could be better visualized.
df.category.value_counts()

Comedy            9723
Web               8820
Product Design    4000
Spaces            3774
Tabletop Games    3633
                  ...
Quilts             100
Chiptune            56
Games               55
Kids                20
Video Art            7
Name: category, Length: 158
df.main_category.unique()

array(['crafts', 'food', 'tech', 'publishing',
			'theater', 'design', 'music', 'art',
			'games', 'photography', 'film & video',
			'fashion','comics', 'dance', 'journalism'],
			dtype=object)
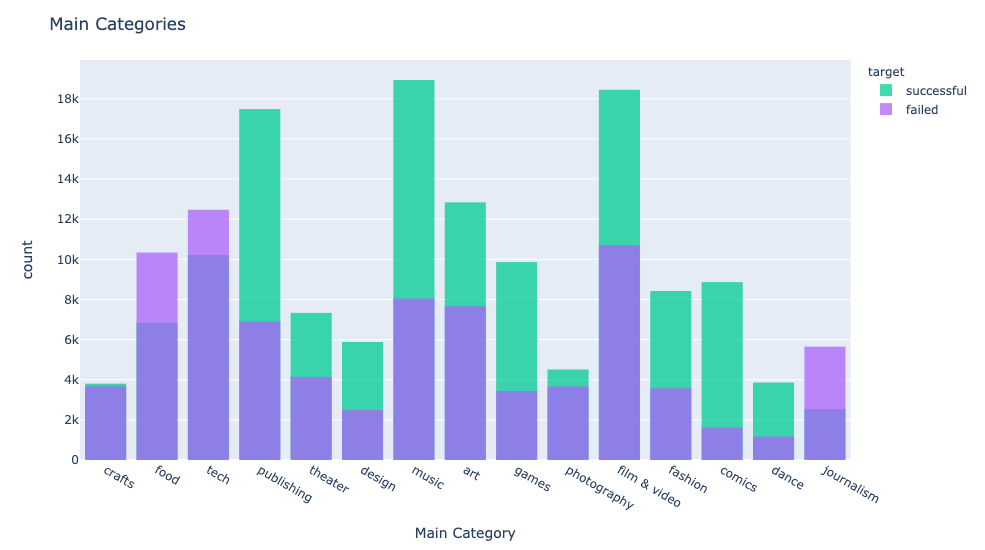
Kickstarter Main Categories
Kickstarter Projects in all catgories from 2009-2020 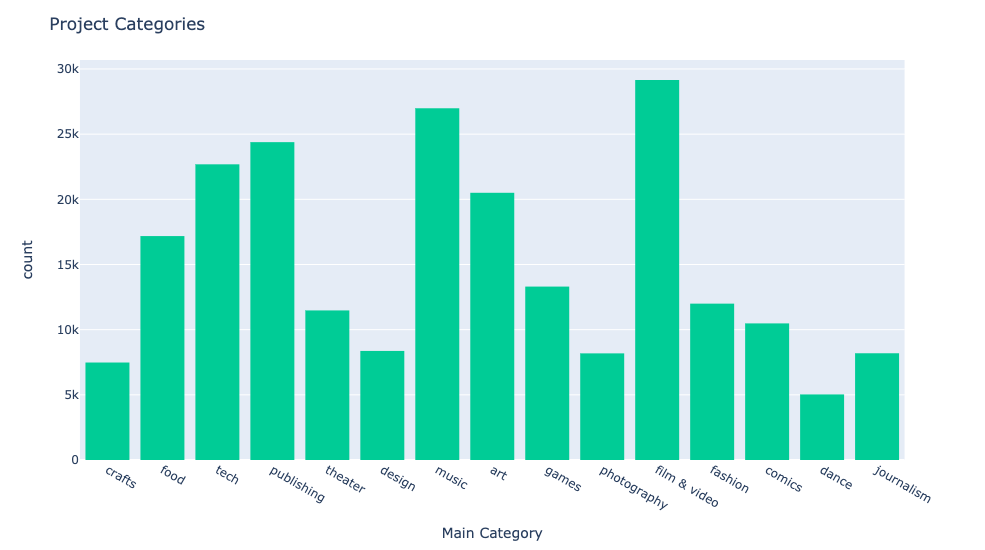
Treemaps and Sunburst charts are visualizations that help to show relationships within data. Both of these graphs illustrate the relation in size of each sub category within their main category.
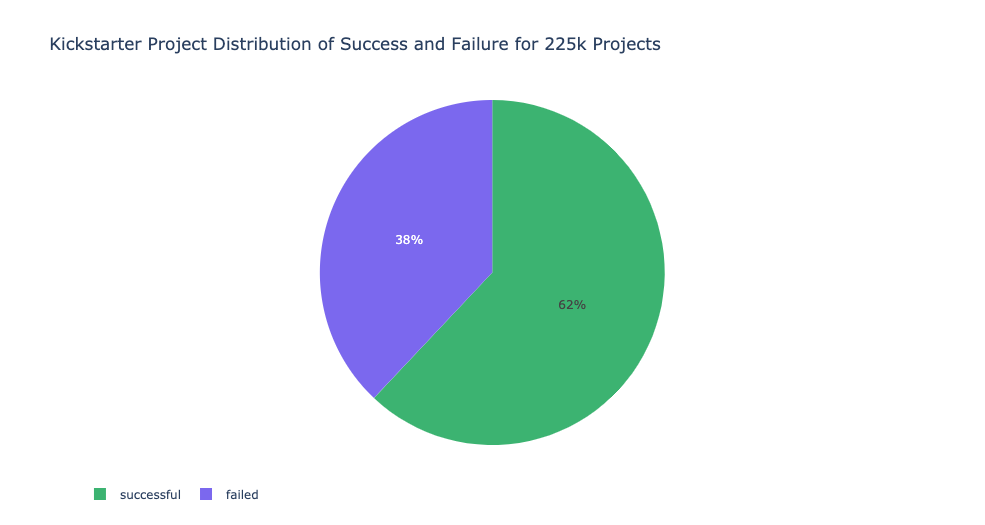
Success and Failure
Delving further into the data, we can see that within each sub-category, there is still another way to split the projects. We can look at which projects were successful and which failed to reach their goals.
Time and Projects
Now then, what are these projects asking for from backers? MONEY.
$5,000 and $10,000 were the most popularly monetary goals for projects. Followed by $1,000, $2,000, and$3,000. Most of these goals could be reached fairly quickly with enough backers.
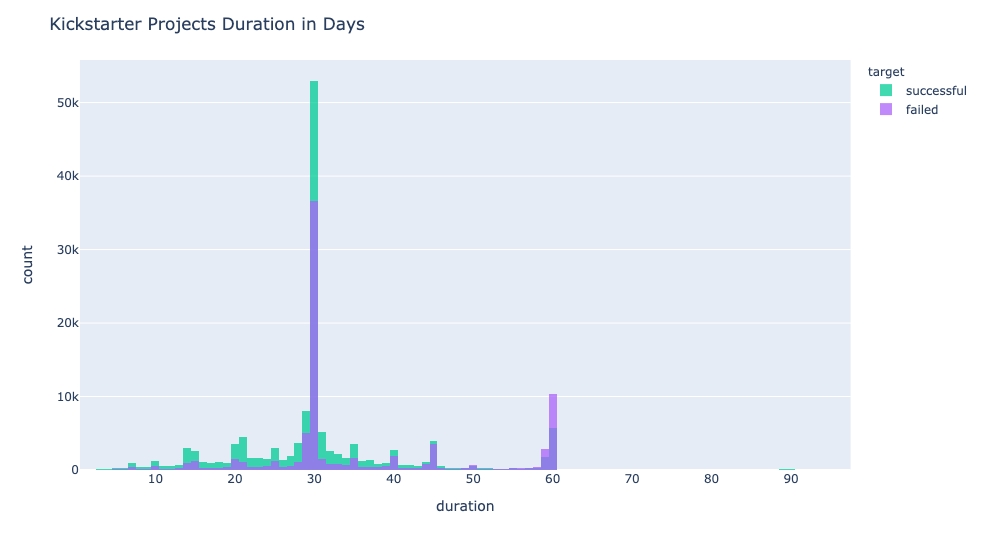
The sooner the pledge is over, the sooner the project could get underway and deliver what was promised to backers as well as go to market as a product.
40% of projects have a deadline of 30 days to complete their funding goal. However, a project reaching its monetary goal does not ensure that the project will fulfill its promises. Projects have had to refund pledged money for not coming through with promises made.
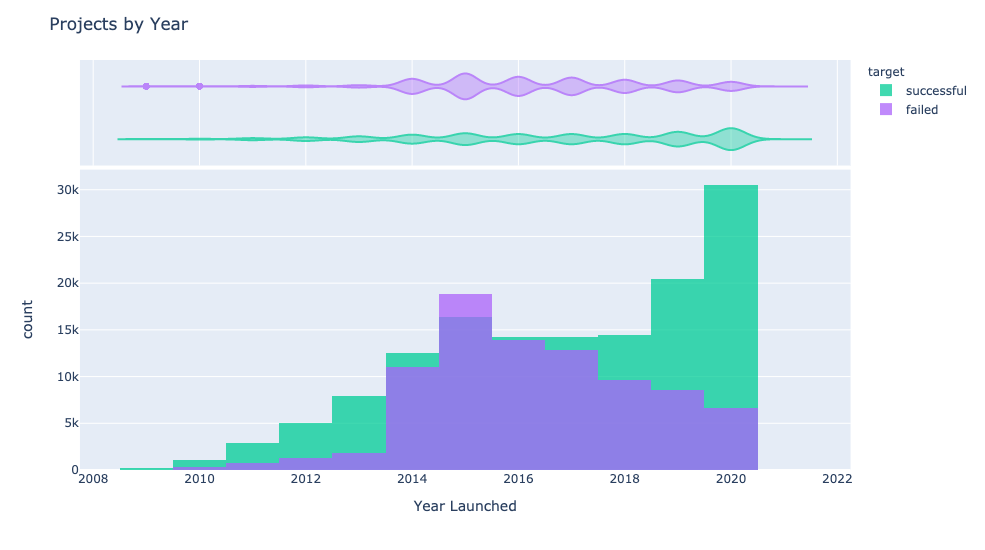
Kickstarter has gained popularity over the years. The spread of Covid-19 in 2020 has sparked more interest in projects being launched and subsequently acquiring backers and reaching their goal. This is something that can be done entirely online and allows for backers to feel like they are part of a community, doing good for others or making themselves useful.
Predictions
Time to apply machine learning to the data.
After a little encoding, it is time for splitsville. The data is divided into a training set and a testing set, in the usual 80:20 split.
For this classification problem, I went with Random Forest, Logistic Regression, and an XGBoost to see which would give me the best accuracy scores.
Scores on testing data:
Random Forest: 0.7761014171406536
Logistic Regression: 0.6619343389529725
XGBoost: 0.7360026619343389
The Random Forest model has the best score, now let’s try to pump it up.
After some hyperparameter tuning, I was able to get the best parameters for the model on the training data.
rfc best params: {'max_depth': 22, 'n_estimators': 1000, 'n_jobs': -1}
rfc scores: 0.7837684885154027
Performance on test data:
rfc accuracy score 0.7894853593611357
I found the Kickstarter data to be highly intriguing, I love to see data that has been compiled over several years. Trends and history are stored in that type of data and it takes a good visual artist to be able to extract the story within.